Altcoins
4 Altcoins to Watch for Drops in June 2024

It is no longer news that the cryptocurrency market witnessed a surge in trading activity in May. This has driven the values of many altcoins to new highs. Over the past 30 days, the global cryptocurrency market capitalization has increased by 17%.
However, as June approaches, some altcoins are set to decline. Crypto assets such as Cardano (ADA), Bitcoin Cash (BCH), Axie Infinity (AXS), AND The sandbox (SAND) have seen a growth in bearish sentiment, which has put them at risk of losing some of their gains in the short term.
Cardano (ADA) bears have leverage
As of this writing, Cardano is trading at $0.44. Its price peaked at $0.50 on May 21 and declined by 12%.
Its Awesome Oscillator (AO) confirmed the current trend of the ADA distribution as the indicator returned red histogram bars at press time. This indicator measures market momentum and identifies an asset’s current trend and potential price reversal points.
When an asset’s AO shows red bars, its short-term momentum falls faster than its long-term momentum. Red bars typically suggest increased selling pressure and suggest the possibility of a price decline.
For context, ADA’s AO has returned only red bars since April 1, suggesting that bearish bias has dominated the coin market for over 60 days.
To know more: How to buy Cardano (ADA) and everything you need to know
Cardano Analysis. Source: TradingView
If selling pressure continues to rise, ADA’s price could fall to $0.40, a price level it last traded at in December 2023.
Bitcoin Cash (BCH) bulls take a backseat
The price of Bitcoin Cash (BCH) has fallen by more than 10% in the last ten days. This is attributable to a surge in capital flight from the money market, confirmed by its Chaikin Money Flow (CMF) readings.
This indicator measures the flow of money into and out of the BCH market. Traders use it to gain insight into the strength and direction of a trend. It signals market strength when its value is positive and above the zero line. This suggests that buying pressure is high and money is flowing into the market.
Conversely, a negative CMF value shows that more people are selling than buying, a precursor to a drop in prices.
The altcoin’s CMF has been positioned below the zero line since May 23. At the time of writing this article, the indicator value was -0.06.
Furthermore, the points that make up the Parabolic Stop and Reverse (SAR) indicator of BCH have confirmed the increase in selling pressure, especially in the last few days. This indicator also tracks the price movement of an asset.
To know more: How to buy Bitcoin Cash (BCH) and everything you need to know
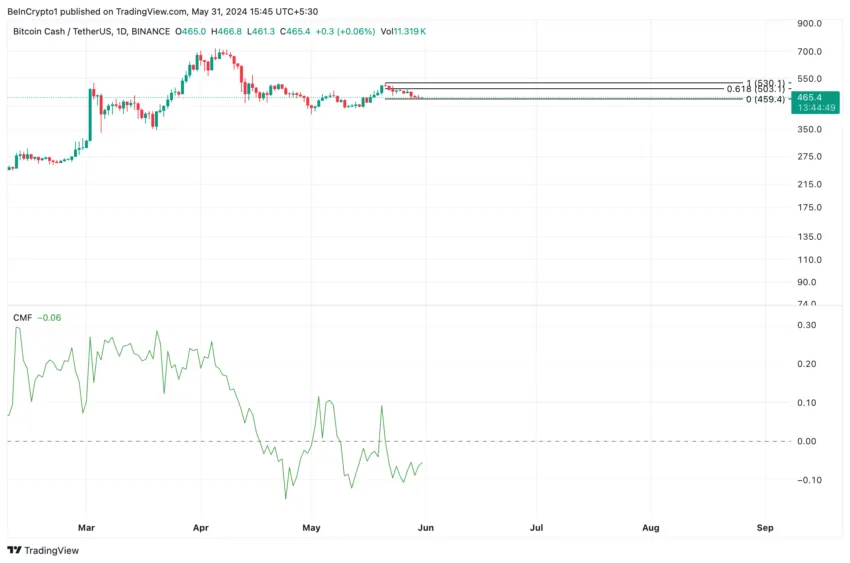

When its points are above the asset price, the market is said to be in decline due to a surge in selling activity. If this distribution trend of BCH continues, its next price could be $459.4.
Axie Infinity (AXS) tends to suffer more losses
The price of AXS, the governance token that powers the leader play to earn gaming platform Axie Infinity, grew 11% last month. However, as its price has fallen below the 20-day exponential moving average (EMA), signaling a spike in selling pressure, AXS may lose some of these gains in the coming weeks.
The 20-day EMA is significant because it helps track the average price of an asset over the last 20 days. When the price of an asset falls below this key moving average, it signals a shift from buying to selling. It is a bearish signal and traders interpret it as a sign of a trend reversal from an uptrend to a downtrend.
To know more: Axie Infinity (AXS) explained for beginners
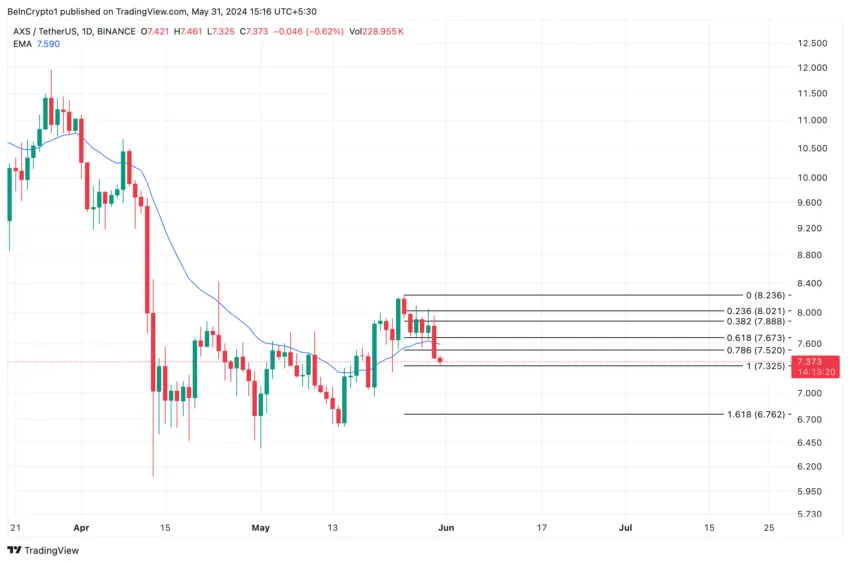
If AXS’s selling pressure continues to skyrocket, its price could fall to $7.3 and then to the long-term support level of $6.76 if profit-taking continues unabated.
The Sandbox (SAND) sees an increase in sales
The last of the altcoins is Sandbox (SAND); SAND’s current series of Moving Average Convergence/Divergence (MACD) indicators show that its short-term average is falling below its long-term average. This is a bearish signal that market participants interpret as a signal to take short positions and exit long positions.
This indicator is used to identify changes in the trend, momentum and strength of an asset. As observed in the current SAND setup, when the MACD line (blue) crosses below the signal line (orange), traders are told that it may be a good time to sell as downward pressure on the price of the stock increases. assets.
To know more: The 10 best Metaverse platforms What to watch out for in 2023
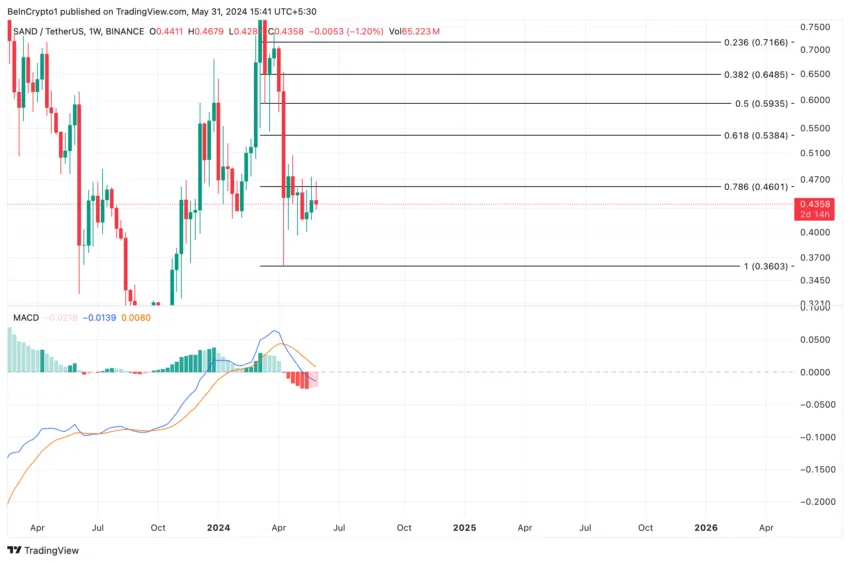
If SAND selling gains momentum, SAND could fall below $0.4 to trade hands at $0.36
Disclaimer
In line with the Trust Project guidelines, this article on price analysis is for informational purposes only and should not be considered financial or investment advice. BeInCrypto is committed to providing accurate and impartial reporting, but market conditions are subject to change without notice. Always conduct your research and consult a professional before making any financial decisions. Please note that our Terms and conditions, Privacy PolicyAND Disclaimer They have been updated.